I’ve gone into a bit of a rabbit hole this weekend. One of WordPress.com VIP‘s biggest sites, Quartz, has a growing set of data visualizations, charts, graphs, etc, at their new branch, Atlas.
In poking around, I found myself at the Github repo for their visualization tool, Chartbuilder. This tool is pretty rad – if you have node on your computer you can run it locally, or you can also use their hosted version, here.
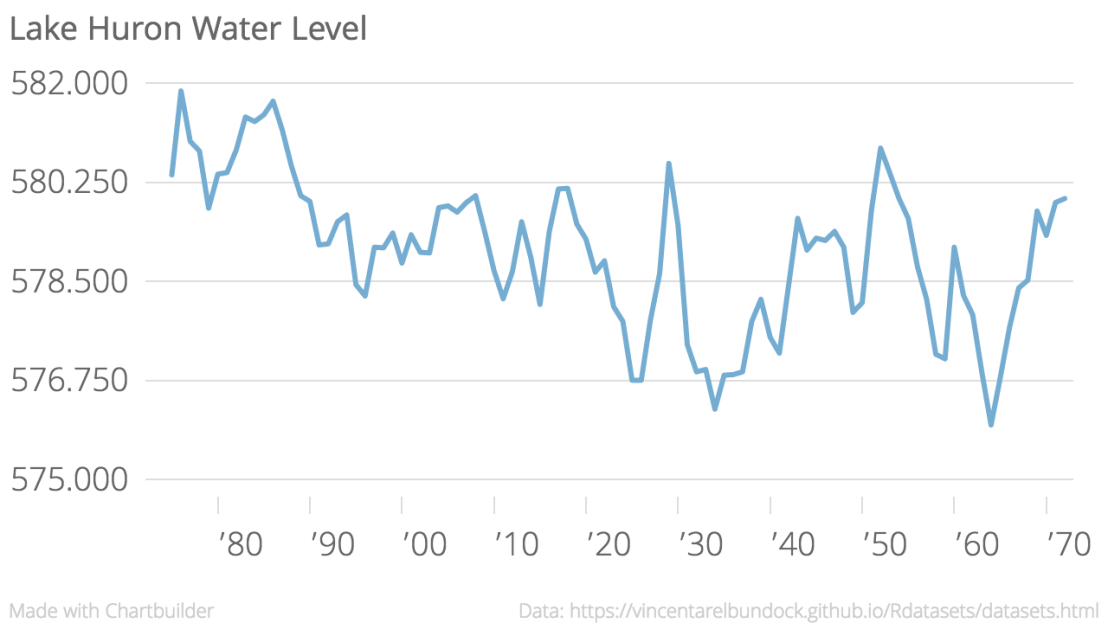
It took maybe six minutes to go from a CSV I’d never seen before (Lake Huron water levels) to a pretty nice little viz:
It offers a lot of flexibility, as well as simple ease of use. Anyone armed with a (properly formatted) CSV can go from numbers on a page to a useful visualization really quickly. I expect I’ll pick this up when I need something to go from numbers to graphic quickly, and the CSV is already nicely formatted.
I do love R and R Studio (ggplot2 for life), but sometimes I don’t want to spend much time tweaking something to be just-so, or searching Google (or Stack Exchange) for something I haven’t seen before.
One thing that’s worth bringing up, as data visualization becomes more accessible and easier for everyone to use, is this: going from a CSV to a chart can be an act of interpretation, and can create a message from the data that may skew your readers toward your perception.
(I’d argue that part of creating moral visualizations is presenting the data in a way that allows the individual to maintain positive liberty, but that’s a bigger discussion for another time)
Consider the viz above – you’d be understandably concerned about the water levels of Lake Huron – they do seem to be varying widely over the past century, and with a general downward trend.
This is a sneaky trick of the Y Axis – note that it only represents a span of eight feet. Look again, with the Y axis starting at 500:

… or, as some purists demand, with the Y axis starting at zero:

I am excited to mix Chartbuilder into my data toolbox, but remember well, dear readers: as visualization tools become easier to use and as the ideas of Big Data become stronger and stronger, there are lots and lots of ways irresponsible or malicious folks can weasel the facts.
Be vigilant out there, gang.
Also, happy Mother’s Day 🙂


