(This Post is part of my 30 day Data Visualization Challenge – you can follow along using the ‘challenge’ tag!)
Thoughts:
– Boom.
– Longer post-mortem in the works about both this challenge in particular and doing a thing every day for 30 days in general.
– Thanks for tuning in 🙂
Code:
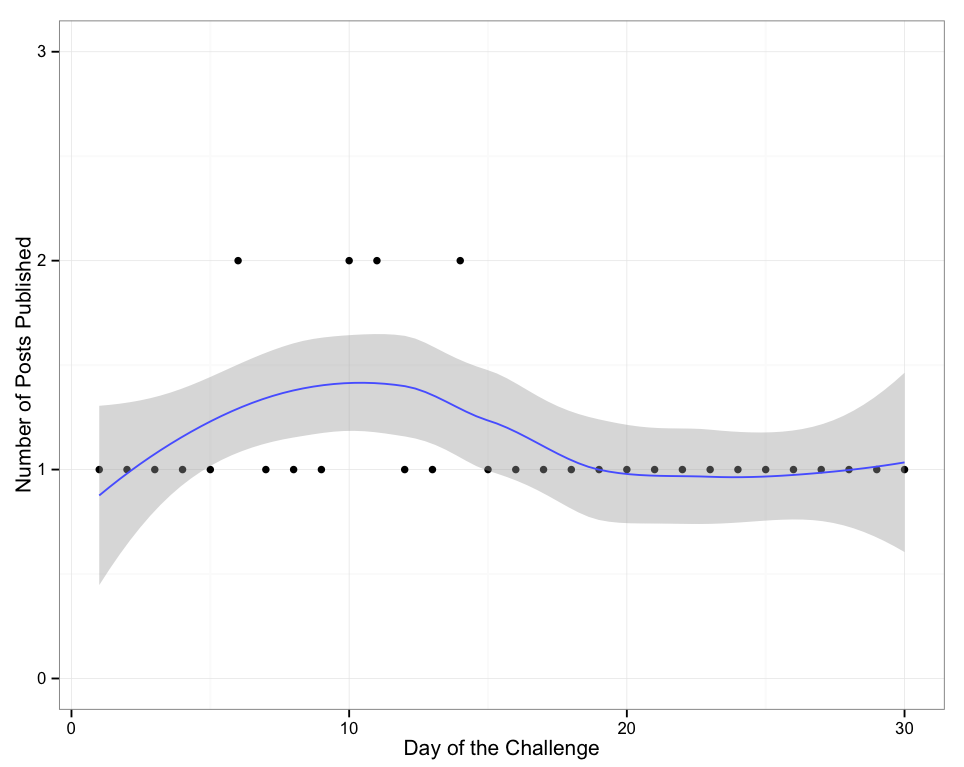
> library(ggplot2)
> qplot(day, n, data=dh) + scale_y_continuous(limits=c(0,3)) + geom_smooth() + ylab("Number of Posts Published") + xlab("Day of the Challenge") + theme_bw()
