Tag: challenge

DVC Day 1

(This Post is part of my 30 day Data Visualization Challenge – you can follow along using the ‘challenge’ tag!)

For the first visualization, I kept it very simple:
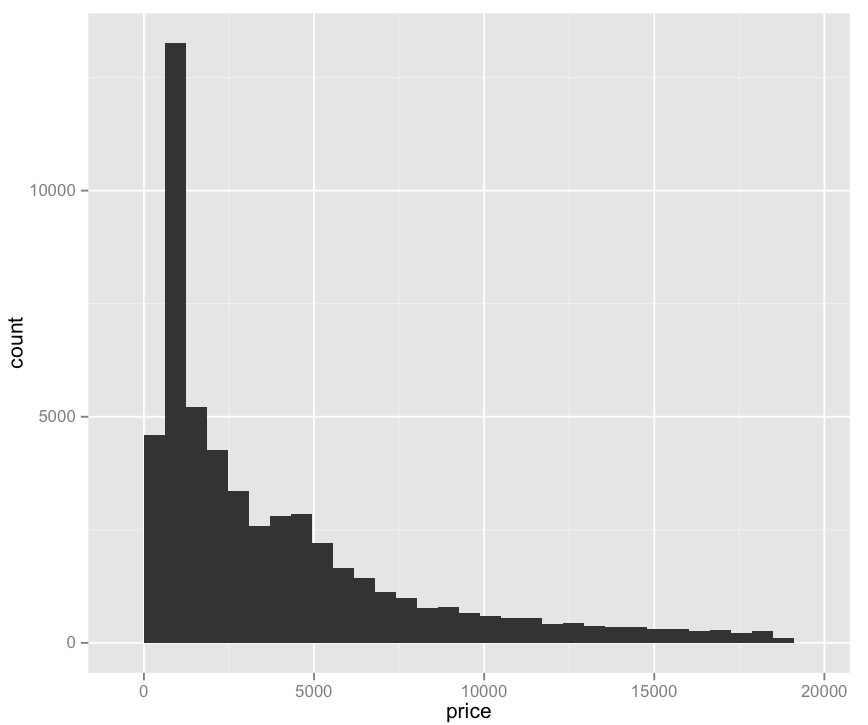
lqB4fx5kCg-3000x3000

Pros:
– Easy to read
– Provides some value: we can see that price does not have a normal distribution, but rather a positively skewed leptokurtic distribution. I am only 70% sure I’m using these words correctly. (Thanks Professor Field!)

Cons:
– Not really very interesting
– Pretty ugly
– Does not explain what determines price, only what the prices are.

Code:

library(ggplot2)
qplot(price, data=diamonds)

30 Days of Data Visualization Challenge

Processed with VSCOcam with hb2 preset

As I work my way through Discovering Statistics Using R and discover other R-related gems across the internet, I realize that I’m only going to get better at this software if I spend time using it.

As such, I’m challenging myself to do a new visualization of a single database every day for the next 30 days – starting today, April 15, and ending May 15. The goal of this is to become more familiar with the R language, more specifically the ggplot2 library, and to think about visualizing data more generally.

The data set I’ll be using is the “Diamonds” data set package with ggplot2.